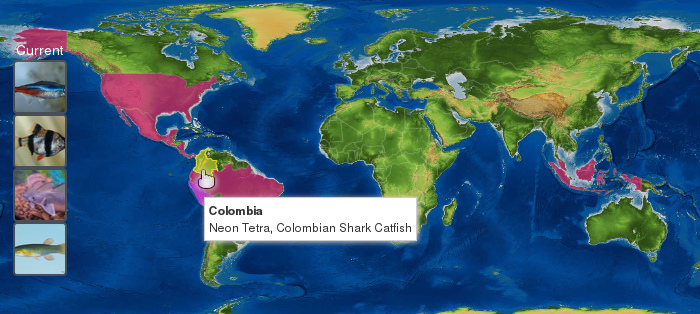
d3-geomap
<d3-geomap>
Polymer Web Component for geographic topology visualization.

This is a web component wrapper to another SVG map visualization library DataMaps by Mark DiMarco. It uses the popular D3 Data-Driven Documents to handle low level HTML and SVG rendering.
Features will mirror DataMaps features, however the format for interaction will be adjusted to follow the web component paradigm. This means significant simplifications will be made to provide an improved usability for the majority of users. Advanced use cases may find a web component encapsulation too restrictive, and those uses are outside the scope of this project.
Maintained by Steven Skelton
Live Demos
Usage
-
Add the library using the Javascript package manager Bower:
bower install --save d3-geomap -
Import Web Components’ polyfill:
<script src="bower_components/webcomponentsjs/webcomponents.min.js"></script> -
Import Custom Element:
<link rel="import" href="bower_components/d3-geomap/d3-geomap.html"> -
Start using it!
 <d3-geomap>
     <!-- add templates here -->
 </d3-geomap>
Options
| Attribute | Type | Default | Description |
|---|---|---|---|
data |
object | null |
keys are region id, values are arbitrary data to be associated with region |
hover |
object | null |
Region hovered over by user pointer |
map |
string | world | Acceptable values are world and usa, will render world and USA maps respectivily. |
multiselect |
boolean | false |
If true, selected is automatically populated by user clicks |
theme |
object | default | CSS styles to apply to map, see Themes |
selected |
object | null |
keys are region id, values are a CSS color. Also supports an array if region ids where defaultSelectedFill color is assumed |
projection |
object | default | Center of map and size, see Projection |
pan |
boolean | false |
Enable mouse/touch pan on drag |
zoom |
boolean | false |
Enable mouse scroll-wheel/touch pinch zoom |
hovertemplate |
function | null |
See hovertemplate |
| Event | Value | Description |
|---|---|---|
clicked |
object | Region clicked by user |
Region IDs
Region IDs are used to uniquely identify regions, and are the keys to both the data and selected object maps.
The world country map uses 3 letter ISO 3166-1 alpha-3 country codes,
while the USA state map uses 2 letter ANSI standard INCITS 38:2009 codes.
Themes
The map is capable to be styled via the theme attribute, which has the following properties:
| Attribute | Type | Default | Description |
|---|---|---|---|
defaultFill |
color | #ABDDA4 | Regular fill for all land regions |
defaultSelectedFill |
color | #FBB917 | Fill for selected regions if selected is an array |
backgroundColor |
color | transparent | Background fill for map (water) |
borderWidth |
int | 1 | Border width (px) for regular regions |
borderColor |
color | #FDFDFD | Border color for regular regions |
highlightFillColor |
color | #FC8D59 | Fill for highlighted/hover region |
highlightBorderColor |
color | rgba (250, 15, 160, 0.2) | Border color for highlighted/hover region |
highlightBorderWidth |
int | 2 | Border width (px) for highlighted/hover region |
cursor |
cursor | pointer | See the W3C Spec http://www.w3.org/wiki/CSS/Properties/cursor |
backgroundImage |
image | none | See the W3C Spec http://www.w3.org/TR/css3-background/#the-background-image |
Projection
The map can be centered and scaled using the zoom object, which has the following properties:
| Attribute | Type | Default | Description |
|---|---|---|---|
x |
float | 0 | Horizontal offset from center in °, range [-180,180] |
y |
float | 0 | Vertical offset from center in °, range [-90,90] |
scale |
float | 1.0 | Scale 1x = 100% |
zoomIncrement |
float | 0.1 | Percent to increment/deincrement on mouse zoom |
zoomScale |
float | 1.0 | Scale due to zoom, 1x = 100% |
panX |
float | 0 | Horizontal offset from center, in pixels |
panY |
float | 0 | Vertical offset from center, in pixels |
Backgrounds
Backgrounds are applied to a div[id="container"] that contains the svg map element. Changing the zoom will automatically
adjust the background to be in the appropriate position.
The world topology is a standard Equirectangular projection.
The usa topology is an Albers USA projection.
Templates
All templates must be nested inside the <d3-geomap> tag to be accessible to the polymer element.
Any filter used (eg: sum in a following example) must be a member of PolymerExpressions.prototype.
See the Polymer Filters section for more details.
As always, only a very limited subset of Javascript is allowed within `` expressions. See the Polymer documentation on Expression syntax.
hoverTemplate
Renderer for what shows when a region is hovered over.
| Template Variable | Description |
|---|---|
| `` | RegionID of region |
| `` | Name of region |
| `` | Custom user data assigned to region (empty by_default) |
History
For detailed changelog, check Releases.
License
MIT License © Steven Skelton